Aggregated Search Data vs. Personalized Custom Crawls
Many marketers unwittingly use incomplete data sets for competitive analysis of Google search rankings for industry sectors or local geographical areas. There are ways to “get at” a more local– or more industry-based analysis. They are available with expensive SaaS search company solutions with client services staff to hand-hold clients through the sophisticated data collection methods and results. This article provides my techniques for your visibility analysis. To crush your competitors: read on.
SEMrush, Searchmetrics, Conductor and BrightEdge provide information on very large sets of the most popular AdWord and organic keywords (over 80mm in the USA with SEMrush) and refresh data frequently. This information is invaluable: if you’ve used it you know. However, most popular is by no means most important in many instances. The data is mostly collected on national level– or worse, in some cases cobbled together from multiple local crawls of SERP– and we are frequently interested in looking at local competition as part or all of the equation.
Even enterprise SEOs should be looking at key local markets if they compete with companies that are local or if they want to see how their competitors are advertising differently by market. Differences in advertising by local market can show, for example, competitors intent on increasing or maintaining market share.
SEMrush allows users to perform “custom crawls,” although manipulating the data outside their intended use of tracking your own set of keywords requires additional SEO savvy. The data they save in user projects it highly granular, allowing us to develop more complex analysis of sectors and geo areas. This is not the “keyword ranker” your Mom and Pop used back in the day. Its heavy emphasis on compiling competitor data, in addition to data for your own domain, makes it possible to create a large set of keywords that best represent a sector or industry and go far beyond examining your own success. In short, this is your solution to a deep dive on analysis of search data by local and by niche.
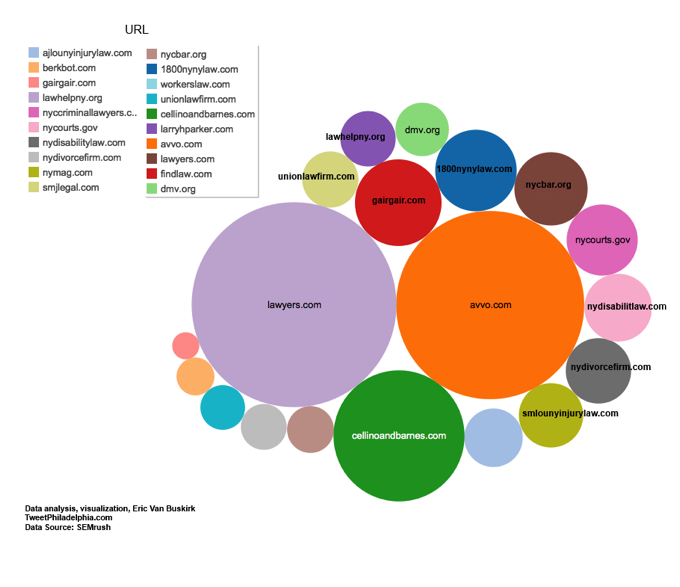
Share of Industry AdWords Visibility: Trial Law Firms Local Search, NYC
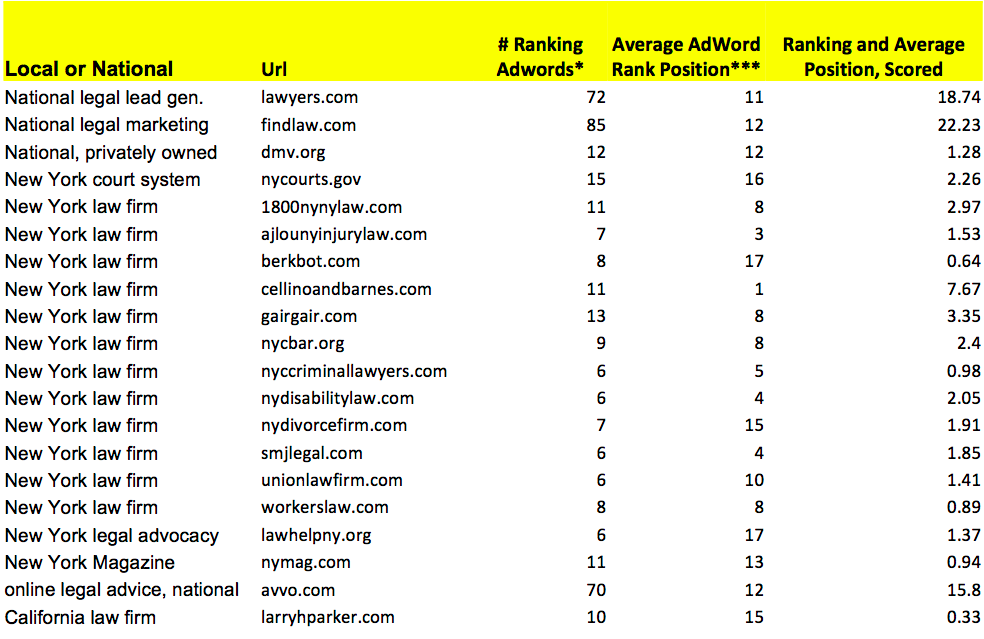
SEMrush Crawlers tracked keywords in the trial law sector in NYC on Google search result pages (SERP). The crawls replicated users searching from a New York City IP address. Results shown for top twenty domains by visibility on SERP, as determined by number of words found ranking and average position of ranking words. The bubble graph shows higher visibility as larger bubble. Pages crawled daily for two weeks in January 2015. Please see table below for further granular results.
Keywords That Define and Encompass Your Sector
The example I used for our “custom crawl” growth hack is trial attorneys in NYC. Keyword research provided a cluster of words that define and best encompass searches for the sector and the geo area. These are both phrase match and LSI based words. I set up the crawls with SEMrush to run daily and do so with the IP entered for NYC. To “force” the results that are not just by geo device IP search but also by local intent, I used keywords most popular around the country for trial lawyers and attorneys and then add the same terms with “NYC” or “New York City” appended (many of these are six word searches with search volume less than four a month, but they are on a local level for what is one of the most competitive sectors and locations in the country. The small numbers matters). In this case, I analyzed for AdWords, not organic, but the tactics are equally powerful for organic data analysis.
Accuracy and Controlling Your Keyword Set
One of the benefits of the final “visibility” score is its accuracy. The score gives a share for each domain. If the crawlers go through 4000 SERPs over a 14-day period, the numbers they return does not contain fuzzy logic. Also, we could change the relative weight of the two metrics being tracked— “number of keywords ranking” (of the total set) and average rank (of all found ranking for each domain) if the low position rankings seem to over-represent success in the final score.
In the below chart avvo.com scores 15.8 and 1800nynylaw.com scores 2.97. We do not know the actual budget, but we know the reach of each. Perhaps 1800nynylaw.com is bidding only on the most expensive words. We lose the budget metric (which we gain when using the national AdWords spend numbers as an estimate usually 3x bellow actual spend). We can see both sites have a similar average rank for their AdWords, but avvo.com is running far more ads. Rounding to whole numbers, the visibility is 5:1: avvo.com has about 500% higher visibility.
Surfacing Domains Flying Under the Local Radar
Another benefit to this type of custom crawl using visibility scores is it shows competitors your company or client didn’t realize exist in a way that a national or head-keyword analysis could not. Many of your competitors are trying to stay under the radar with product offerings. In this case that could be PPC, but it might also be true for organic search, not to mention off-line sales and marketing. You might never know Dunn and Bradstreet is blitzing NYC with ads about trial law because they’re testing a new lead generation program for their lawyer clients in NYC.
Many companies doing local and niche competitive research are interested in the proportion of local to national businesses buying ads. Similarly, the local vs. national company issue shows up on crawls for organic results and reveals companies with content or links you might not know are relevant to your sector.
With AdWords, you will inevitably find mistakes. In this case, there is a California law firm running ads in New York who does not appear to practice on the East Coast. I’ve seen companies buying AdWords nationally when they shouldn’t on a regular basis (my best guess here is they’re not targeting their CA region).
Conclusions From Visibility Keyword Analysis
There are many conclusions from the visibility bubble graph, but what stands out to me is how FindLaw and avvo.com clobber the NYC law firms. This may be largely due to massive discounts they get from Google for the sheer quantity of their monthly ad spend. The law firms dominating the visibility are clearly not “mega” national or international. In fact, every law firm showing up on top does not practice in more than a few US states. The mega law firms don’t seem interested in attracting clients in one of the world’s most litigious, wealthy cities via Google. If you’re working in this space please shed some light for us in the comments.
Perhaps they are better at referral marketing for new clients? Perhaps the “boutique” law firms are actually paying too much per click in the eyes of the mega firms? Perhaps they have embraced and succeeded with conversion rates (although a look at some of these websites show they’ve done a horrible job at their UX!). Comparing the same visibility for organic would be fascinating. Are the mega law firms winning over the small? I bet they are.
* Actual number of ads running on searches directly related to the sector/industry/niche (exact or phrase match).
** Scored by number of paid AdWords, exact or phrase match, with frequency found during two week time period.
*** For example, 44 average rank position means of the first 100 listing of AdWords, the position of their Ad is
at #44th AdWord displayed by Google on average.


